Quickstart: Get Started with Observability
Last modified on 26-Mar-25
In this quickstart, you will:
- Create a Soda Cloud account
- Connect a data source
- Configure your first dataset to enable observability.
Step 1: Create a Soda Cloud Account
- Go to cloud.soda.io and sign up for a Soda Cloud account. If you already have an account, log in.
- By default, Soda creates a Soda-hosted Agent for all new accounts. You can think of an Agent as the bridge between your data sources and Soda Cloud. A Soda-hosted Agent runs in Soda’s cloud and securely connects to your data sources to scan for data quality issues.
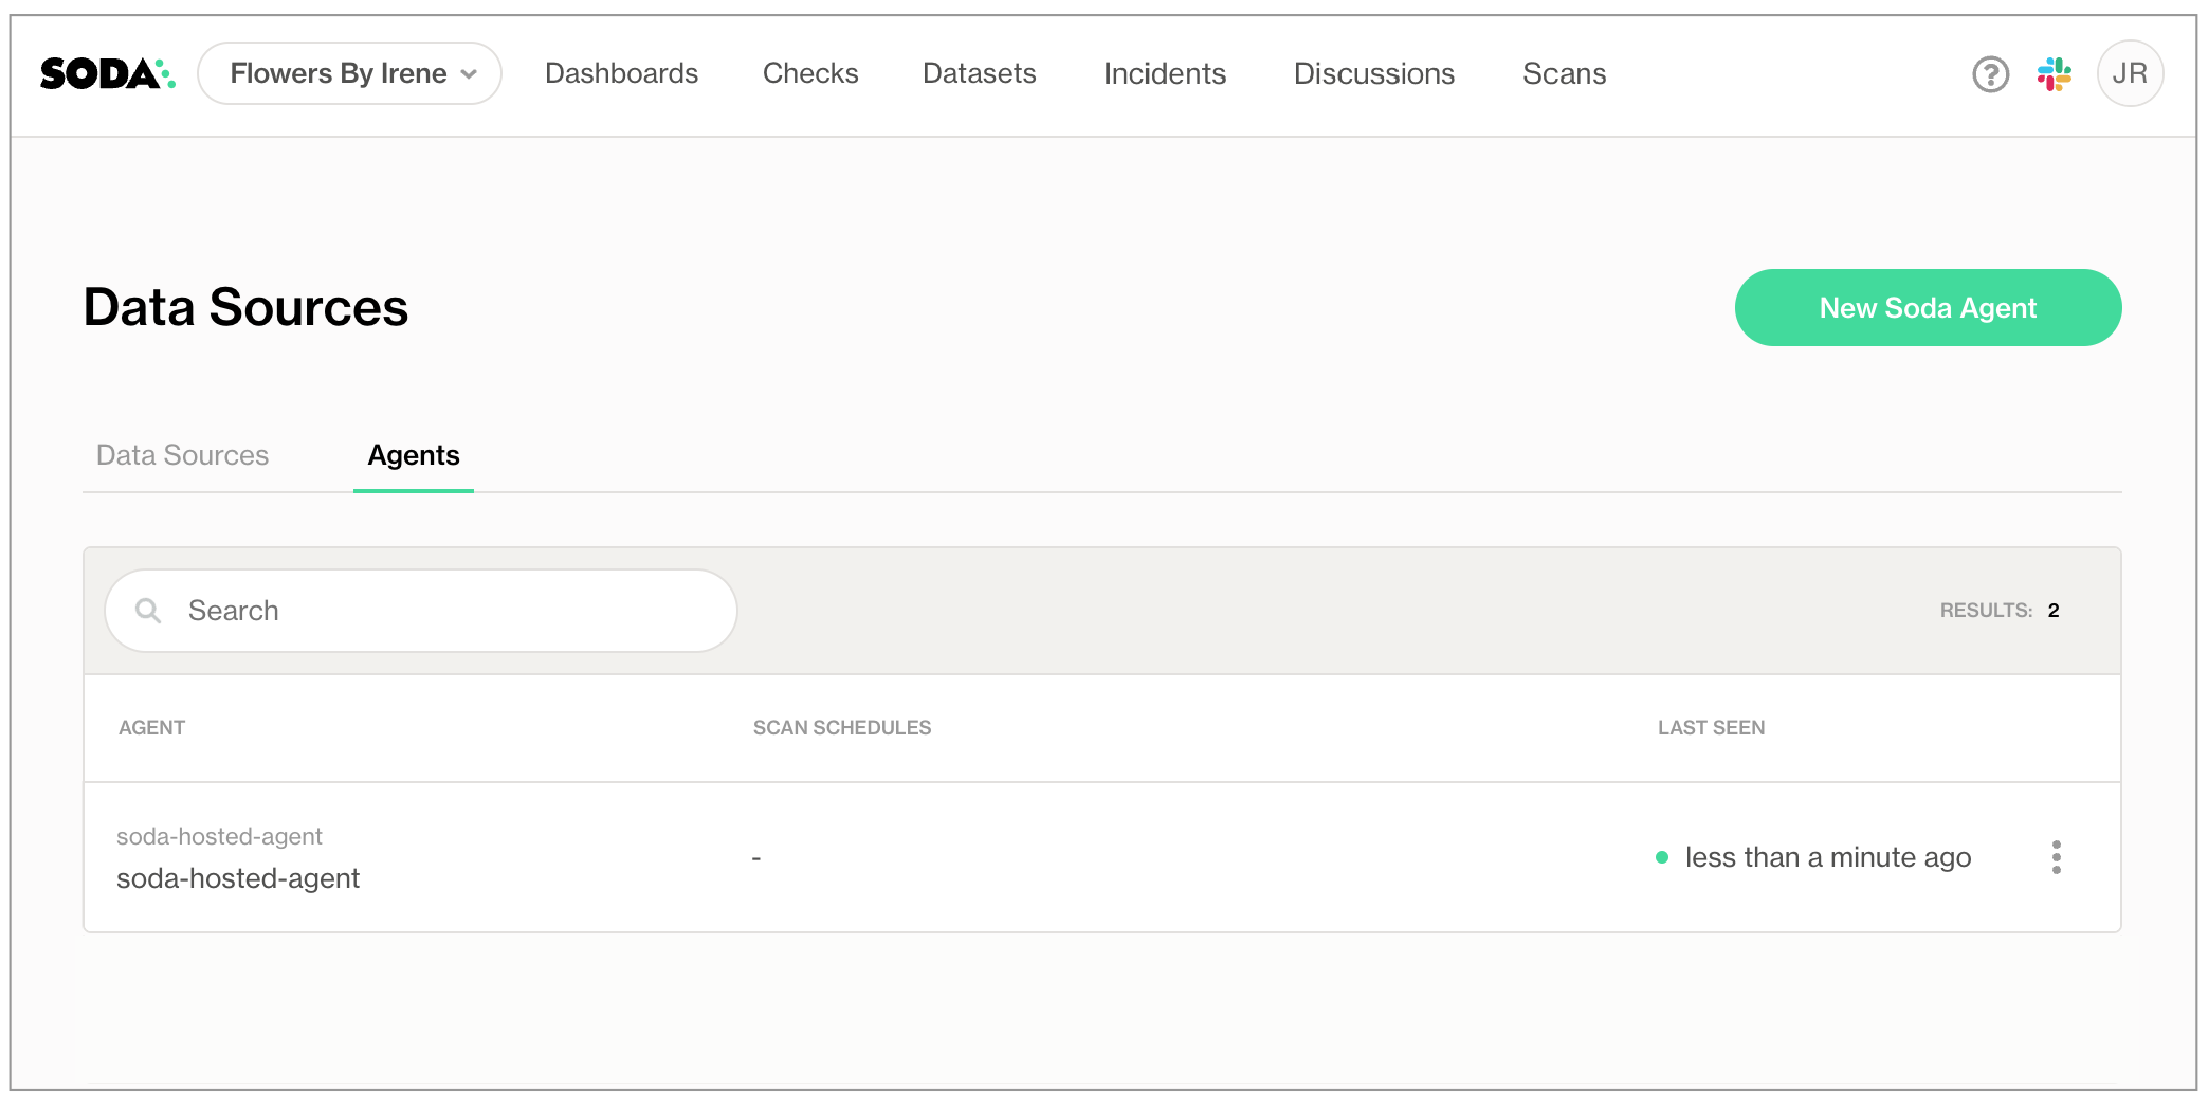
- If you are an admin and prefer to deploy your own agent, you can configure a self-hosted agent:
- In Soda Cloud, go to your avatar > Agents
- Click New Soda Agent and follow the setup instructions
Soda Agent Basics
There are two types of Soda Agents:
- Soda-hosted Agent: This is an out-of-the-box, ready-to-use agent that Soda provides and manages for you. It’s the quickest way to get started with Soda as it requires no installation or deployment. It supports connections to specific data sources like BigQuery, Databricks SQL, MS SQL Server, MySQL, PostgreSQL, Redshift, and Snowflake. Soda-hosted agent (missing)
- Self-hosted Agent: This is a version of the agent that you deploy in your own Kubernetes cluster within your cloud environment (like AWS, Azure, or Google Cloud). It gives you more control and supports a wider range of data sources. Self-hosted agent (missing)
A Soda Agent is essentially Soda Library (the core scanning technology) packaged as a containerized application that runs in Kubernetes. It acts as the bridge between your data sources and Soda Cloud, allowing users to:
- Connect to data sources securely
- Run scans to check data quality
- Create and manage no-code checks directly in the Soda Cloud interface
The agent only sends metadata (not your actual data) to Soda Cloud, keeping your data secure within your environment. Soda Agent basic concepts (missing)
Step 2: Add a Data Source
- In Soda Cloud, go to your avatar > Data Sources.
- Click New Data Source, then follow the guided steps to create the connection. Use the table below to understand what each field means and how to complete it:
Attributes
| Field or Label | Guidance |
|---|---|
| Data Source Label | Provide a unique identifier for the data source. Soda Cloud uses the label you provide to define the immutable name of the data source against which it runs the Default Scan. |
| Default Scan Agent | Select the Soda-hosted agent, or the name of a Soda Agent that you have previously set up in your secure environment. This identifies the Soda Agent to which Soda Cloud must connect in order to run its scan. |
| Check Schedule | Provide the scan frequency details Soda Cloud uses to execute scans according to your needs. If you wish, you can define the schedule as a cron expression. |
| Starting At (UTC) | Select the time of day to run the scan. The default value is midnight. |
| Custom Cron Expression | (Optional) Write your own cron expression to define the schedule Soda Cloud uses to run scans. |
Anomaly Dashboard Scan Schedule  | Provide the scan frequency details Soda Cloud uses to execute a daily scan to automatically detect anomalies for the anomaly dashboard. |
- Complete the connection configuration. These settings are specific to each data source (PostgreSQL, MySQL, Snowflake, etc) and usually include connection details such as host, port, credentials, and database name.
Use the appropriate guide below to complete the connection:
- Connect to BigQuery
- Connect to Databricks SQL
- Connect to MS SQL Server
- Connect to MySQL
- Connect to PostgreSQL
- Connect to Redshift
- Connect to Snowflake
Step 3: Configure Dataset Discovery
Dataset discovery captures metadata about each dataset, including its schema and the data types of each column.
- In Step 3 of the guided workflow, specify the datasets you want to profile. Because dataset discovery can be resource-intensive, only include the datasets you need for observability. See Compute consumption and cost considerations for more detail.
Step 4: Add Column Profiling
Column profiling extracts metrics such as the mean, minimum, and maximum values in a column, and the number of missing values.
- In Step 4 of the guided workflow, use include/exclude patterns to define which columns Soda should profile. Soda uses this information to power the anomaly dashboard. Learn more about column profiling syntax.
profile columns:
  columns:
    - "%.%"  # Includes all columns of all datasets
    - "prod%.%"  # Includes all columns of all datasets that begin with 'prod'
Step 5: Add Automated Monitoring Checks
In Step 5 of the guided workflow, define which datasets should have automated checks applied for anomaly scores and schema evolution.
If you are using the early access anomaly dashboard, this step is not required. Soda automatically enables monitoring in the > dashboard. See Anomaly Dashboard for details.
Use include/exclude filters to target specific datasets. Read more about automated monitoring configuration.
automated monitoring:
  datasets:
    - include prod% # Includes all the datasets that begin with 'prod'
    - exclude test% # Excludes all the datasets that begin with 'test'
Step 6: Assing a Data Source and Dataset Owner
In the step 6 of the guided workflow, assign responsibility for maintaining the data source and each dataset.
- Data Source Owner: Manages the connection settings and scan configurations for the data source.
- Dataset Owner: Becomes the default owner of each dataset for monitoring and collaboration.
For more details, see Roles and rights in Soda Cloud.
Step 7: Test Connection and Save
- Click Test Connection to verify your configuration.
- Click Save to start profiling the selected datasets.
Once saved, Soda runs a first scan using your profiling settings. This initial scan provides baseline measurements that Soda uses to begin learning patterns and identifying anomalies.
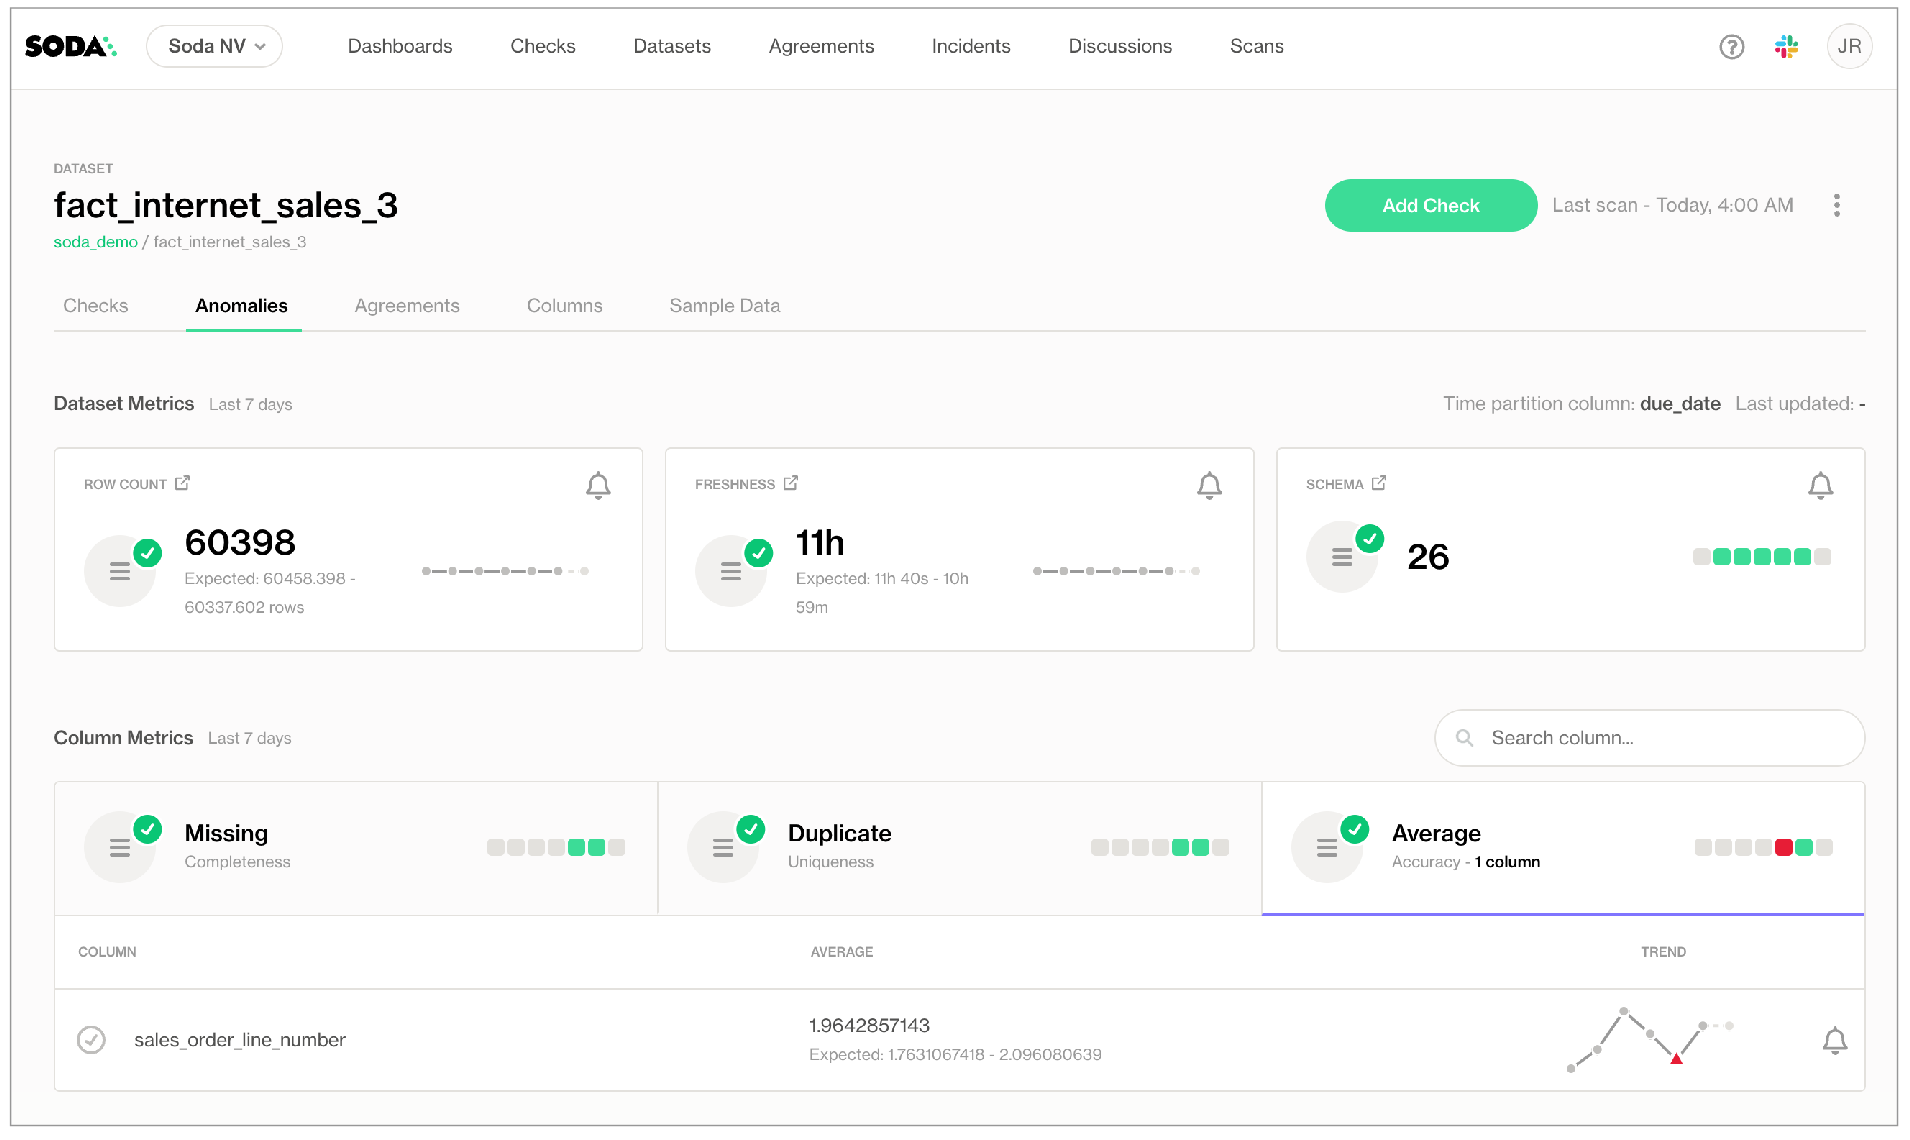
Step 8: View Metric Monitor Results
- Go to the Datasets page in Soda Cloud.
- Select a dataset you included in profiling.
- Open the Metric Monitors tab to view automatically detected issues.
🎉 Congratulations! You’ve set up your dataset and enabled observability.
What’s Next?
Now that your first dataset is configured and observability is active, try: